A Data-Driven Approach to Enhancing Insurance Customer Satisfaction & Loyalty in the Insurance Sector
Customer satisfaction study
Client
A leading insurance provider catering to exporters and bankers seeking risk coverage and financial security.
Objective
Measure the satisfaction levels among existing policyholders (exporters and bankers).
Identify key triggers and barriers in service delivery that influence customer perception.
Segment customers into Delighters, Devotees, Diffident, and Detractors to refine engagement strategies.
Evaluate Net Promoter Score (NPS) and customer loyalty across different regions.

Methodology
Conducted structured interviews with policyholders and bankers.
Sample was drawn from the client’s shared database to ensure relevance and accuracy.
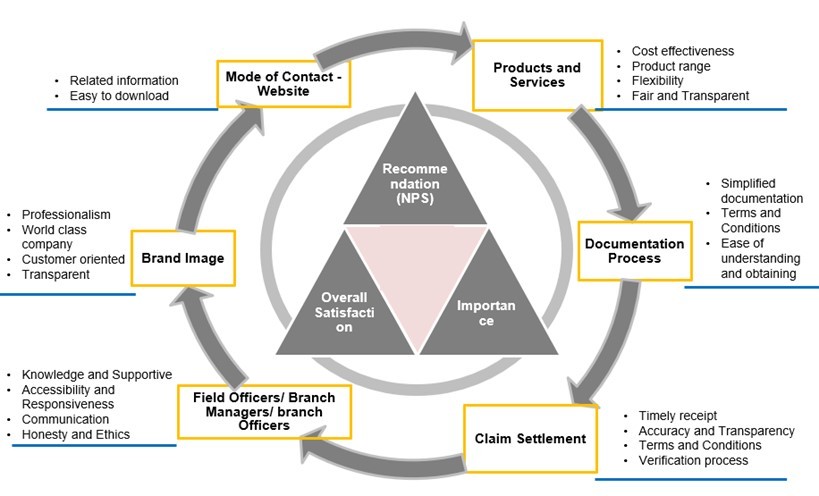
Key focus areas included:
✔ Service Quality
✔ Brand Image Perception
✔ Claims Process Efficiency
✔ Customer Relationship Management
✔ Likelihood to Recommend the Brand (NPS)
Sample Coverage
Nationwide representation
Service gaps analysis conducted in segmented regions to identify location-based

Findings
Strong Brand Image:
96% of respondents reported high satisfaction and indicated a high correlation between brand image and customer service expectations, implying a strong perception of the brand's credibility.
Brand Image emerged as the highest-rated factor, signifying that policyholder experience associate the brand with reliability and comprehensive offerings.
Claims Process Concerns:
Bankers’ satisfaction survey reported lower satisfaction with the claim process, particularly in the Eastern region.
Delays and procedural inefficiencies were cited as primary pain points.
Regional Disparities in Relationship Management:
In the East, bankers rated the brand lower on customer relationship management, indicating the need for improved engagement and support.
Loyalty & Retention Insights:
73% of policyholders expressed continued patronage to the brand, even in a competitive landscape.
Top 2 Box Score (high satisfaction responses) stood at 96%, showcasing strong brand affinity.
Net Promoter Score (NPS evaluation):
South Region: Scores were fair, indicating moderate advocacy.
East Region: Scores were significantly low, suggesting dissatisfaction and potential churn risk.
Overall, NPS was not healthy across all zones, highlighting areas for improvement in customer experience.


Outcome
The study provided data-backed insights that empowered the brand to:
Strengthen its brand image by reinforcing value propositions.
Optimize the claims processing, particularly in the East, to enhance satisfaction.
Improve relationship management efforts in underperforming regions.
Develop targeted strategies to uplift NPS and convert detractors into promoters.
Conclusion
The research highlighted that while the brand enjoys strong market credibility, regional service disparities and claims process bottlenecks impact customer satisfaction and advocacy. Addressing these service gaps in insurance, process improvements, and customer engagement strategies will help bolster brand loyalty and increase positive word-of-mouth recommendations.
Are you struggling with service gap analysis, NPS evaluation or Retention rate analysis? Our expert market research solutions help you optimize customer satisfaction, streamline processes, and build long-term loyalty.
Contact us today to explore custom research solutions tailored to your business needs to elevate your insurance customer experience with Data-Driven Strategies!
KEEP READING


